Introduction
Monitoring proves to be a very important part of maintaining systems, services and applications on premise and in the cloud. It allows you to be aware of the current state of the monitored resources – whether it is reliable and its performance is good enough for your needs.
The monitoring is more or less a passive process unless you have configured some kind of notifications in the form of alerts. The AWS cloud offers notifications when monitoring is configured. It sends emails when different events happen on the monitored infrastructure. AWS calls them “alarms”.
Default EC2 metrics and alarms
When it comes to setting up alarms in the context of EC2 instances, there are several metrics that are automatically provided by AWS when an EC2 instance is created:
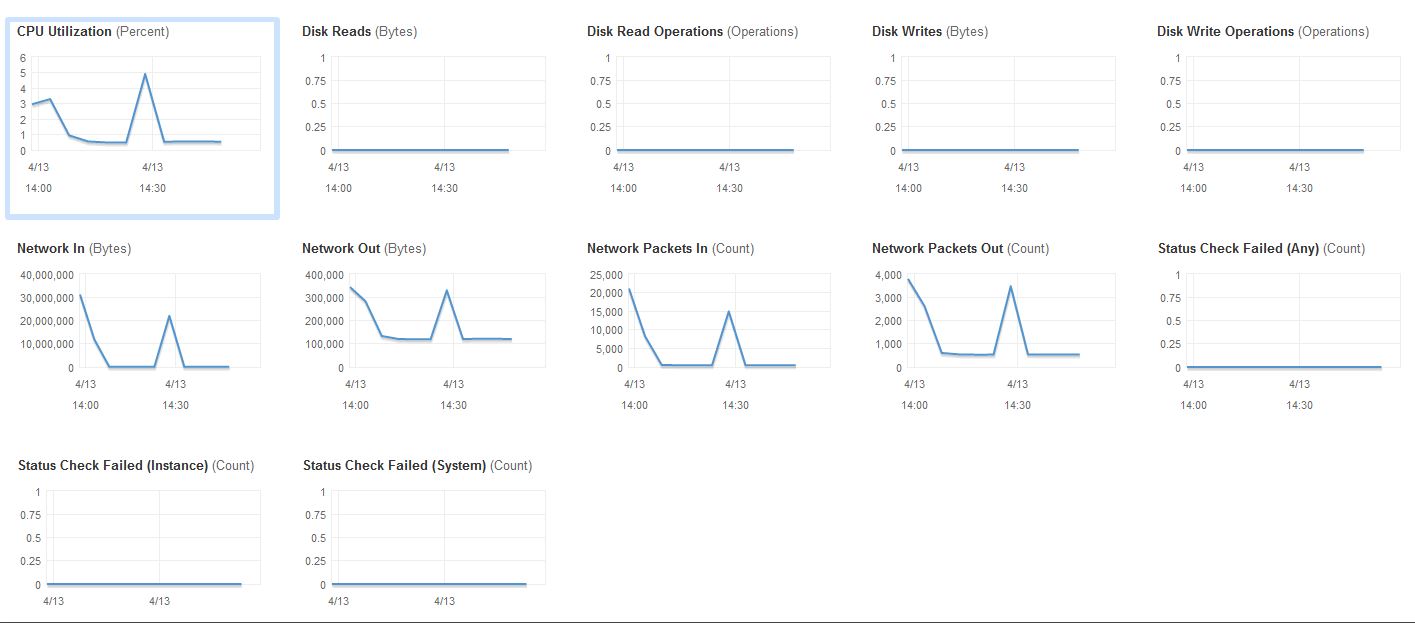
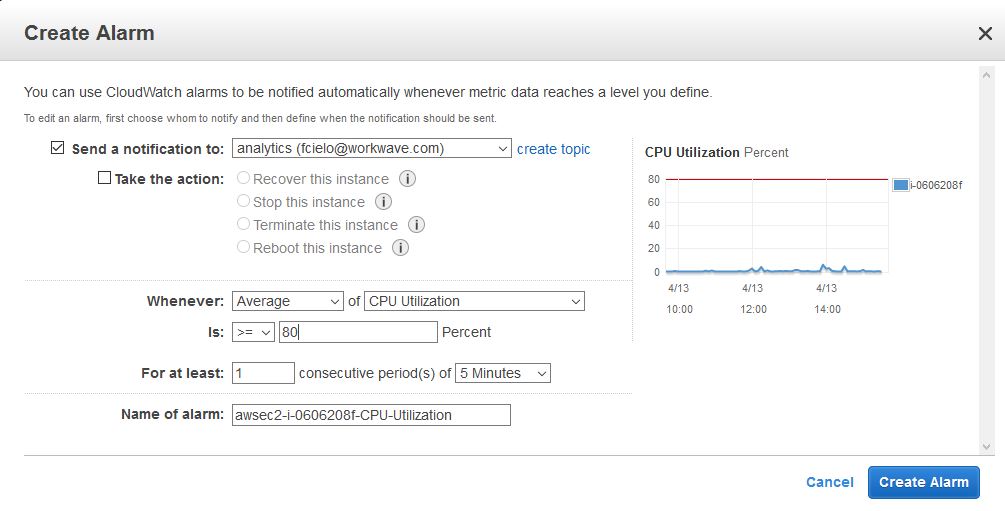
If you are interested in creating alarm for “CPU Utilization” for example, that should be a pretty easy and straightforward action. You just need to click “Create Alarm” button.
Then you need to fill in the threshold you desire:
But you will notice you have almost all valuable metrics. Why almost? Because one of the important things you want to have an eye on it – the RAM consumption is missing.
Set up EC2 Memory alarm
Setting this type of alarm is a pretty easy task if you follow the correct steps.
First of all you need to configure the EC2 instance to start streaming the necessary information about RAM to CloudWatch. To do so, you need to log in to your EC2 instance and update the following file:
“C:\Program Files\Amazon\Ec2ConfigService\Settings\AWS.EC2.Windows.CloudWatch.json”
If you open it, you should notice the following section:
{

"Id": "PerformanceCounter",

"FullName": "AWS.EC2.Windows.CloudWatch.PerformanceCounterComponent.PerformanceCounterInputComponent,AWS.EC2.Windows.CloudWatch",cd_hawk-agent1_1

"Parameters": {

"CategoryName": "Memory",

"CounterName": "Available MBytes",

"InstanceName": "",

"MetricName": "Memory",

"Unit": "Megabytes",

"DimensionName": "",

"DimensionValue": ""

}

}
{

"Id": "PerformanceCounter",

"FullName": "AWS.EC2.Windows.CloudWatch.PerformanceCounterComponent.PerformanceCounterInputComponent,AWS.EC2.Windows.CloudWatch",

"Parameters": {

"CategoryName": "Memory",

"CounterName": "Available MBytes",

"InstanceName": "",

<em>"<strong>MetricName</strong>": "<strong>My-AvailableMemory</strong>",</em>

"Unit": "Megabytes",

"DimensionName": "",

"DimensionValue": ""

}

}
I am going to change the value of the “MetricName” because it is going to be shown in CloudWatch. If you have multiple machines on which you want to setup such alarm, it is nice to use the following pattern for MetricName:
<Machine-Name>-AvailableMemory
This way you will be able to distinguish for which particular machine is this metric for.
Once you configure this part of the file, you should make sure the data is actually sent to CloudWatch. To do so you need to modify another section of this .json file. Search for ““Id”: “CloudWatch”” and at the end of the file you should came across this fragment:
{

"Id": "CloudWatch",

"FullName": "AWS.EC2.Windows.CloudWatch.CloudWatch.CloudWatchOutputComponent,AWS.EC2.Windows.CloudWatch",

"Parameters": {

"AccessKey": "<your-aws-<strong>access</strong>-key>",

"SecretKey": "<your-aws-<strong>secret</strong>-key>",

"Region": "<region-where-the-info-will-be-streamed>",

"NameSpace": "Windows/Default"

}

}
Make sure you populate the following with proper values:
- <your-aws-access-key>
- <your-aws-secret-key>
- <region-where-the-info-will-be-streamed> – for example “us-east-1”
This is a channel through which you will try to stream the necessary information to Cloudwatch. And to make sure this channel is used by the “PerformanceCounter”, at the very end of the file the following should be updated:
"Flows": {

"Flows": [

"PerformanceCounter,CloudWatch"

]

}
Make sure you have this mapping. Once you do this, save the file.
The next step is to open the “Services” panel on the target machine (Control Panel -> Administrative Tools ->Services) and make sure you restart the “Ec2Config” service.
Once it is restarted, in order to verify everything goes well, open “C:\Program Files\Amazon\Ec2ConfigService\Logs\Ec2ConfigLog.txt”. Make sure you have information messages logged and no relative error message is thrown there. If everything is okay, you could continue with the next steps.
Open your AWS Console and navigate to the region you used above when configuring where to stream the information. In our case we picked up “us-east-1”, which means you should open the Cloudwatch service from N. Virginia region. In the left pane you should see the Metrics option. And on your right you should be presented with:
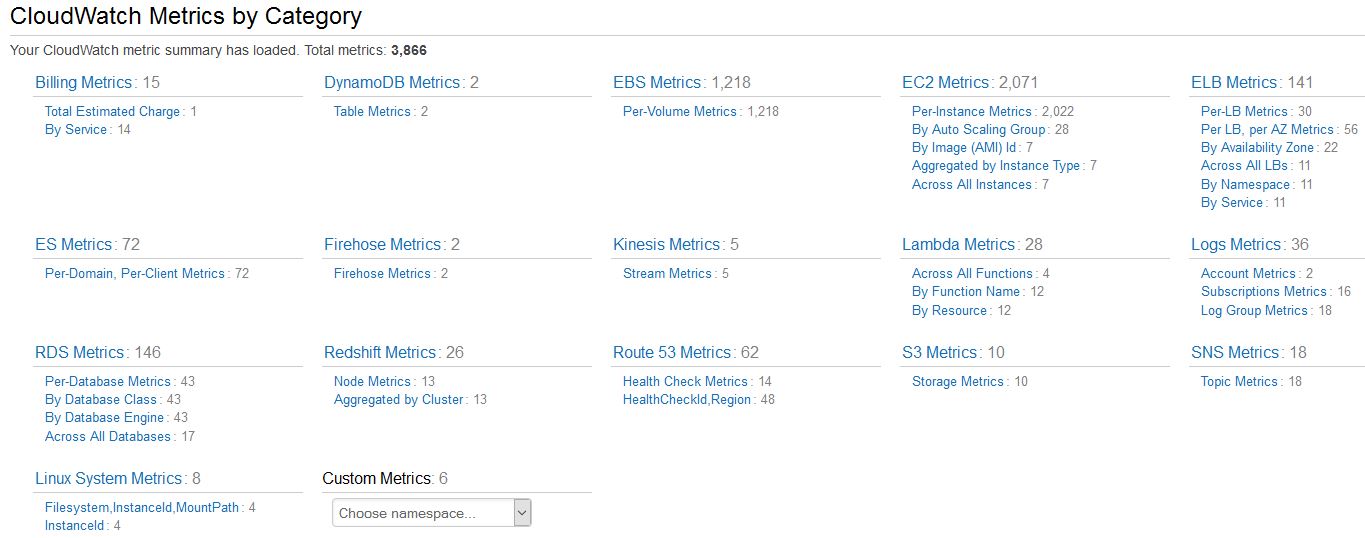
We are interested by the Custom Metrics. If you click on the drop down control, the following option should be present – Windows/Default. Make sure you select it. You should then be redirected to the metrics available under that option. In our case the My-AvailableMemory metric should be there:
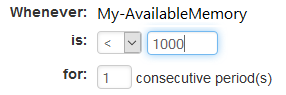
At this stage you should be able to stream whatever Memory Performance Counter info you want from your EC2 machine to CloudWatch, monitor the provided data and create notifications/alarms for the desired information.